How Pandas Profiling Can Speed up your Exploratory Data Analysis (EDA) in Machine Learning
 |
| Pandas Profiling |
According to Wikipedia, Exploratory Data Analysis is defined as follows
In statistics, exploratory data analysis (EDA) is an approach to analyzing data sets to summarize their main characteristics, often with visual methods. A statistical model can be used or not, but primarily EDA is for seeing what the data can tell us beyond the formal modeling or hypothesis testing task.EDA is very important in understanding large datasets while building machine learning models.Generally speaking, EDA is a collection of various findings like Data Quality, Data Spread and Variable Relationships.
Data Quality refers to information that define the quality of data and makes sure if is an information is actually necessary for decision making and also helps us determine the overleap to optimise the data analysis process. This includes finding Missing Values, Number of Variables, Data types and Duplicates.
Data Spread describes how similar the set of observed values are for a data item. This information helps us with identifying basic information required as a part of Initial Data Analysis(IDA). This includes finding Mean, Standard Deviation, Median, Min Max, Histograms etc.
Variable relationships between various entities in the dataset using Pearson or Spearman Rank Correlation etc.,
PANDAS PROFILING
Profiling is a process that helps us understand our data and Pandas profiling helps us automate this first level of Exploratory Data AnalysisPandas package provides us with functions like describe() and info() that are normally used forgetting a detailed information of the dataset. However, it only gives a very basic overview of the data and doesn’t help much in the case of large datasets.
 |
| Pandas Profiling Overview |
Why describe() is not enough?
Method Signature: data.describe(percentiles=None, include=None, exclude=None)Please go through the documentation for description on each parameter : https://pandas.pydata.org/pandas-docs/stable/reference/api/pandas.DataFrame.describe.html
Generates descriptive statistics that summarize the central tendency, dispersion and shape of a datasets distribution, excluding NaN values. Generates descriptive statistics that summarize the central tendency, dispersion and shape of a dataset’s distribution, excluding NaN values.
Analyzes both numeric and object series, as well as DataFrame column sets of mixed datatypes. The output will vary depending on what input parameters is supplied.
For example, let us consider the titanic dataset from Kaggle (https://www.kaggle.com/c/titanic)
import pandas as pd
data = pd.read_csv("titanic_dataset.csv")
data.describe()
The describe() gives us the following set of information which looks like a compact summary of our dataset.
 |
| describe() function |
But, what if your dataset is too extensive and contains more number of columns? In this case, the describe() is very basic, maybe a little too basic for anyone that's serious about machine learning. Here comes the need for Pandas Profiling.
pandas_profiling extends the pandas DataFrame with df.profile_report() for quick data analysis. It presents us with an interactive HTML report on statistics of each column including
- Essentials: type, unique values, missing values.
- Quartile statistics like minimum value, Q1, median, Q3, maximum, range, interquartile range.
- Descriptive statistics like mean, mode, standard deviation, sum, median absolute deviation, coefficient of variation, kurtosis, skewness.
- Most frequent Values
- Histogram
- Correlations highlighting of highly correlated variables, Spearman, Pearson and Kendall matrices
- Missing values matrix, count, heatmap and dendrogram of missing values
import pandas as pd
import pandas_profiling
data = pd.read_csv('titanic.csv')
pandas_profiling.ProfileReport(data)
You might face issues while trying to import pandas_profiling like the following
 |
| pip install pandas profiling |
This occurs because you haven't installed the package which you can do using the following commands in your python command line using pip or in your anaconda prompt using conda
pip install pandas-profiling
pip install https://github.com/pandas-profiling/pandas-profiling/archive/master.zip
conda install -c conda-forge pandas-profiling
This should help you install the pandas profiling library and help you import the package without any issues
import pandas as pd
import pandas_profiling data = pd.read_csv("titanic_dataset.csv") #data.describe()
pandas_profiling.ProfileReport(data)
This gives you a detailed report on your dataset which includes Overview, Variables, Correlations, Missing Values and a Sample data which includes head() and tail() of your dataset
 |
| Overview |
 |
| Variables |
 |
| Correlations |
 |
| Missing Values |
 |
| Sample data |
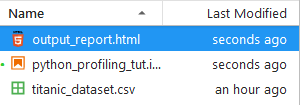
If you want to export this report to the HTML format and share with a larger audience, save the ProfileReport to an object and use the to_file() function:
profile = data.profile_report(title='Pandas Profiling Report')
profile.to_file(output_file="output_report.html")
 |
| Export report |
The report is pretty detailed including charts wherever necessary. Pandas Profiling can make your life easier while performing Exploratory Data Analysis in Machine Learning.
Refer to the documentation for more details and examples : https://pandas-profiling.github.io/pandas-profiling/docs/
Hope you enjoyed the article.
Happy Machine Learning!


Comments
Post a Comment